Analytics Gallery
Below are analytics examples using the Spark API datasets. Use the buttons to filter by product, and click on any image to download the related code sample.
Having trouble with our scripts?
Reach out to our dedicated API team at data@sparkcommodities.com
Freight
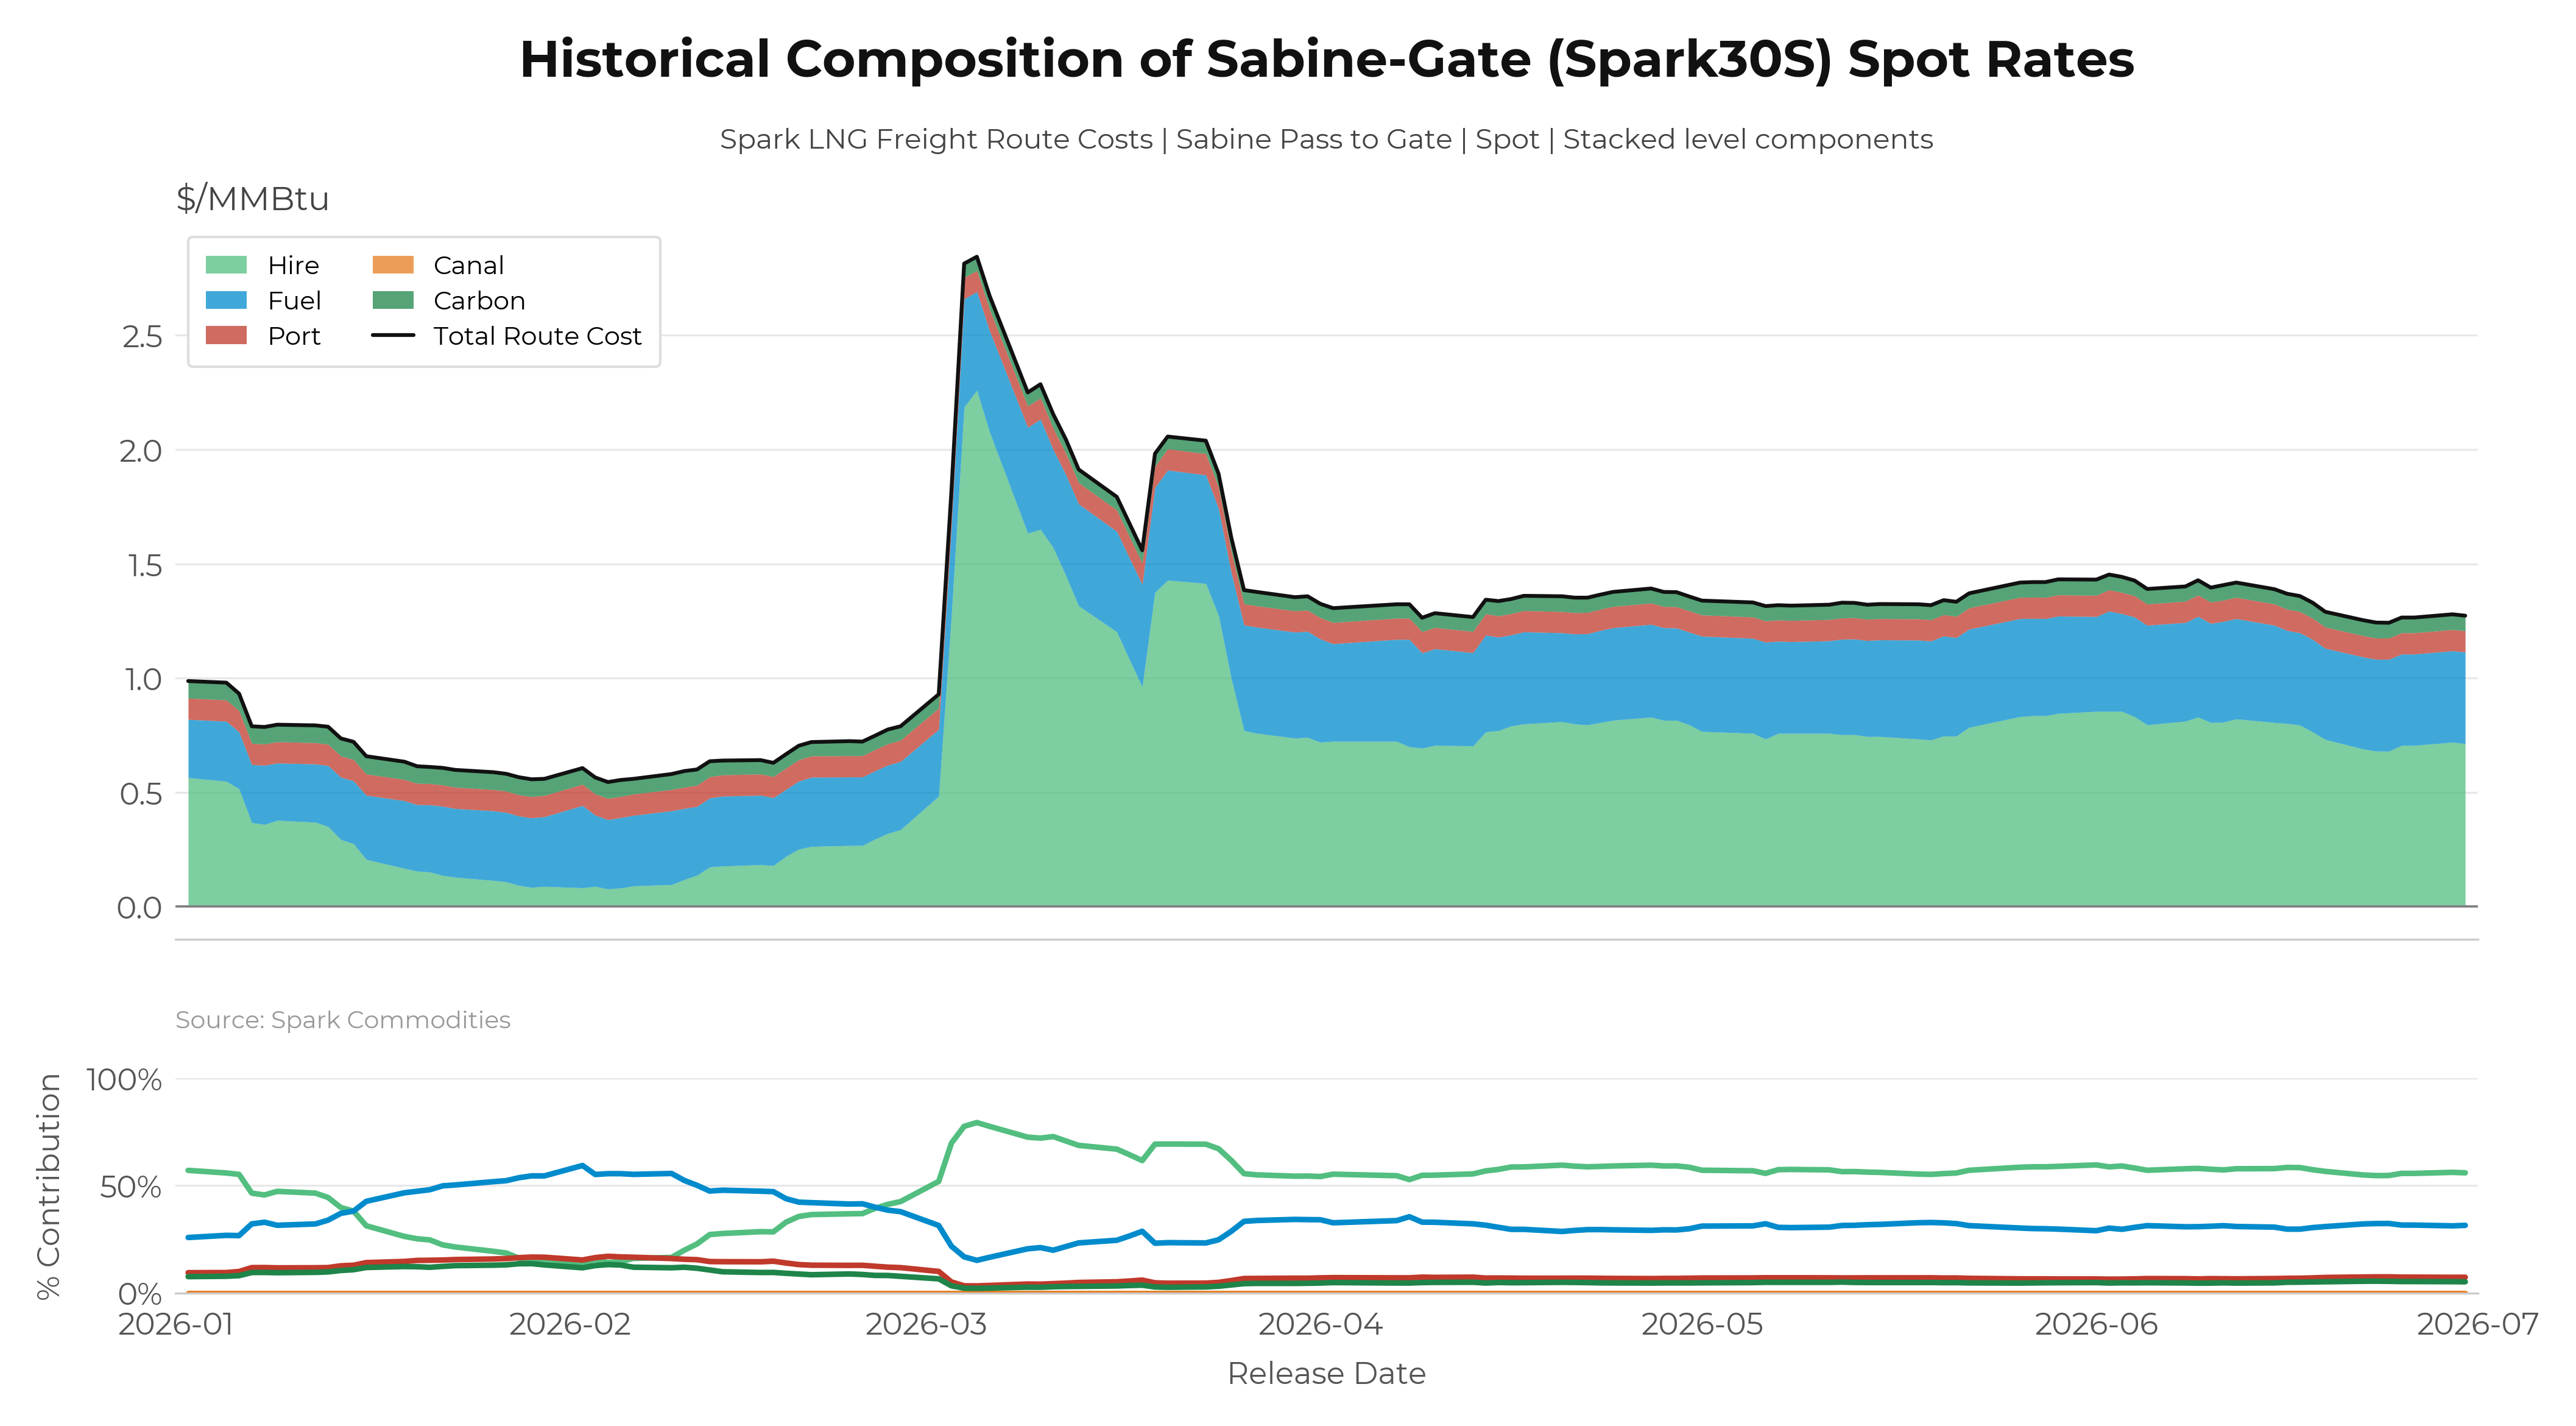
Freight Routes - Component Analysis
NewPlot the underlying components behind any global freight route to understand which component is the dominant factor
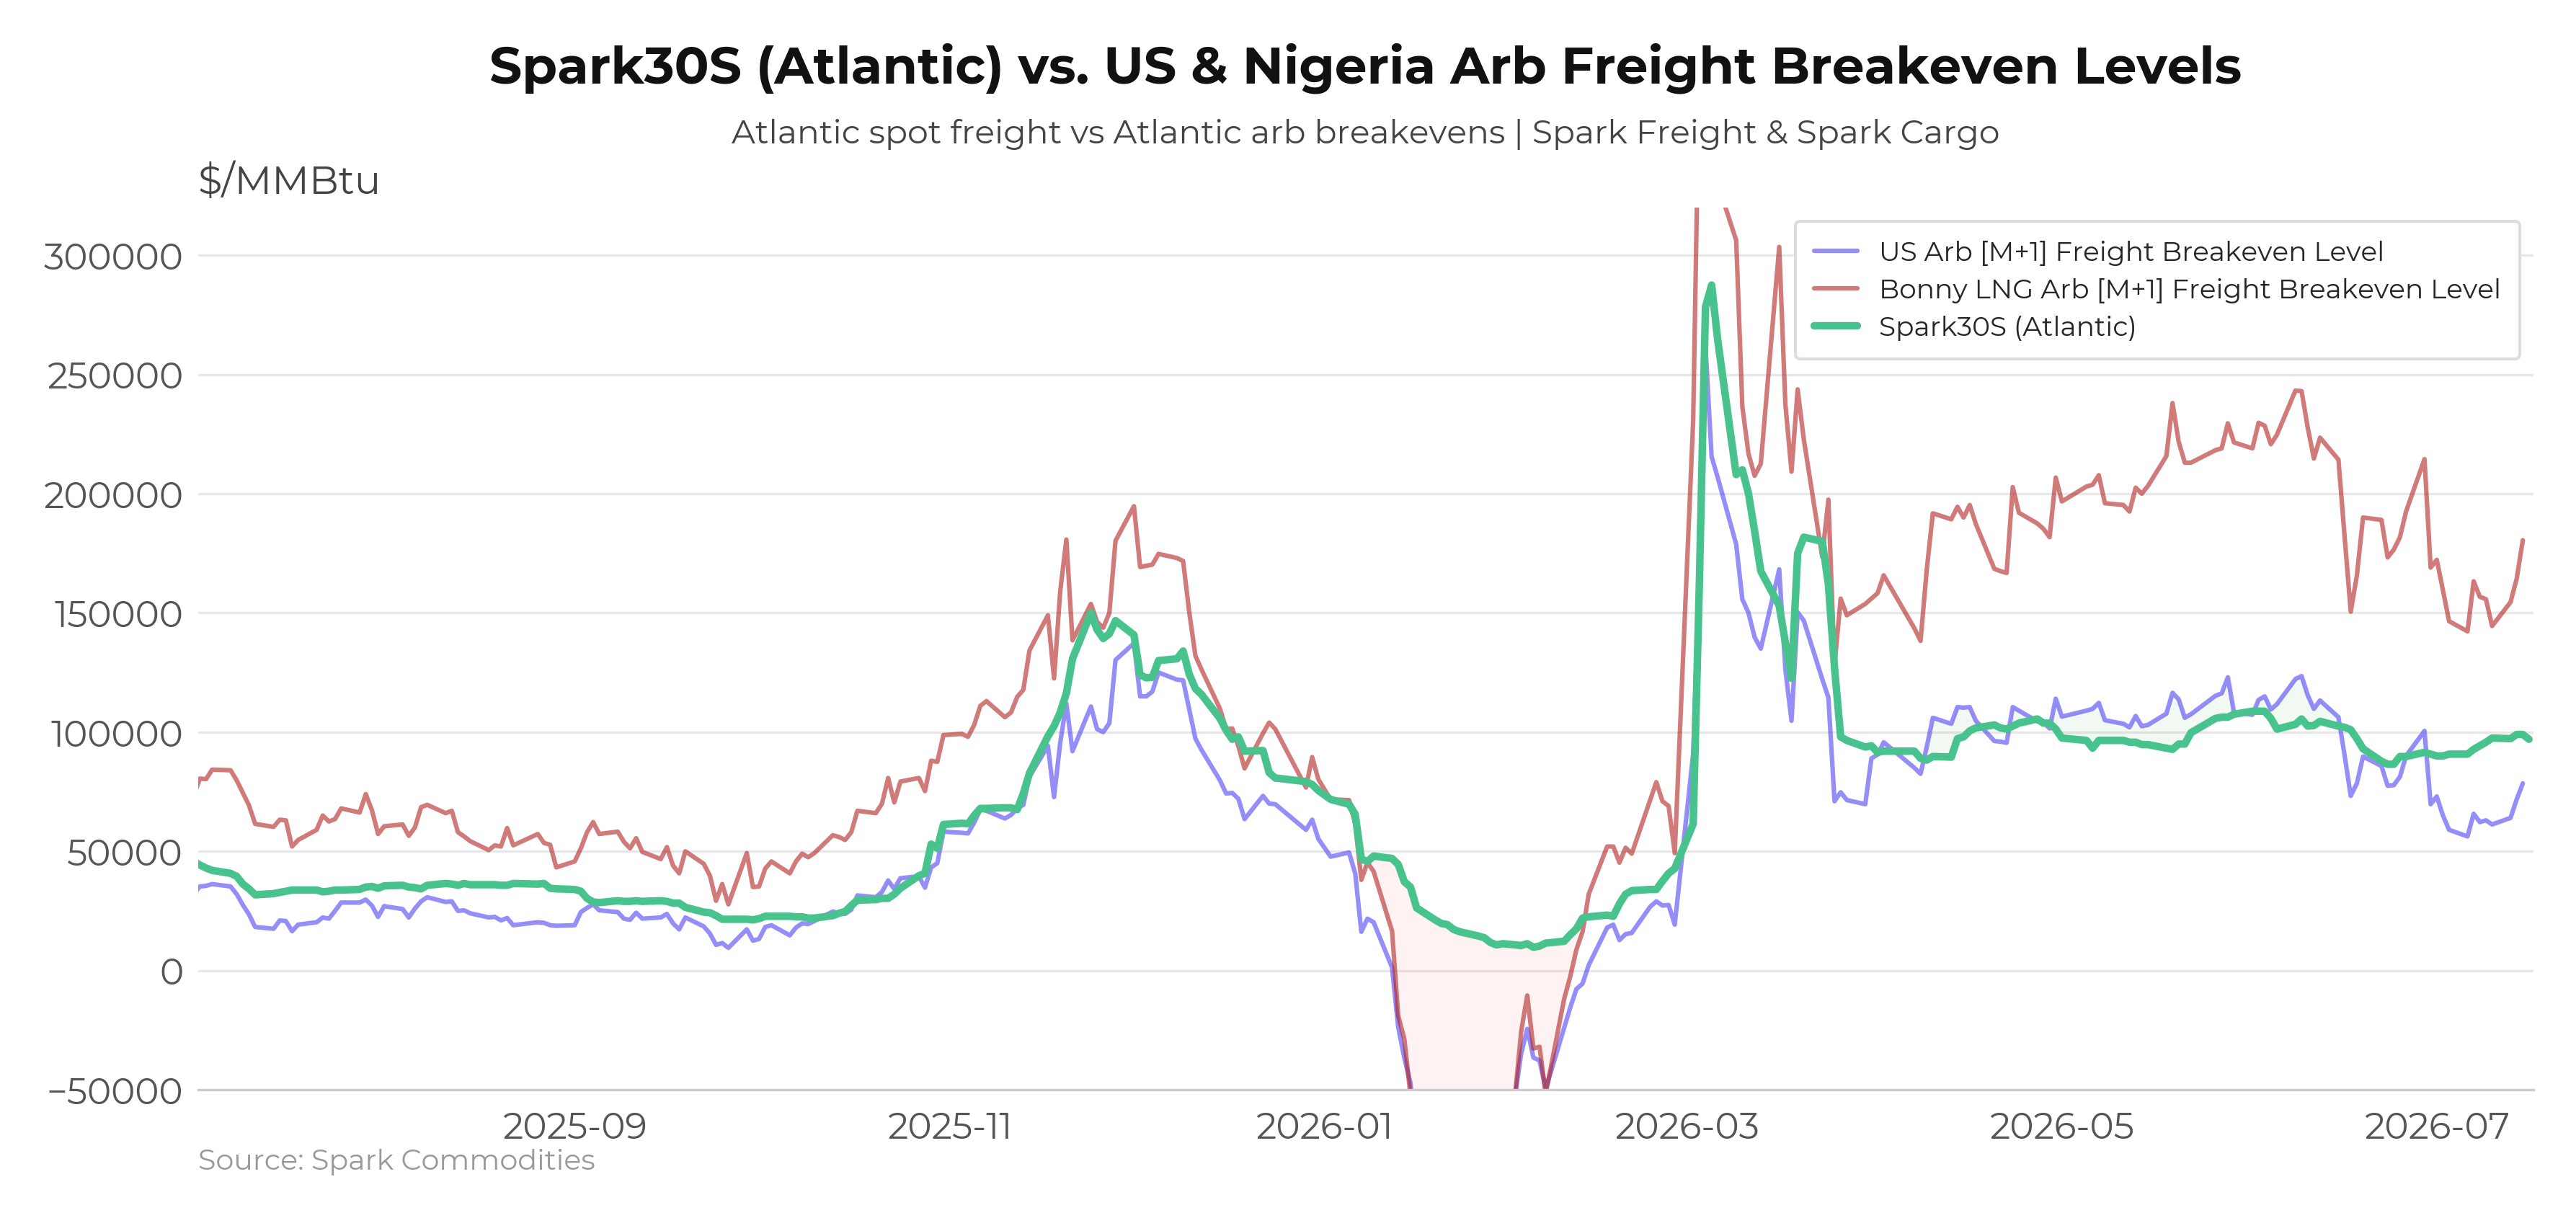
Atlantic Spot Freight vs M+1 Arb Breakevens
NewCompare Atlantic freight spot rates vs the front month arb freight breakeven levels to identify potential lead-lag correlations.
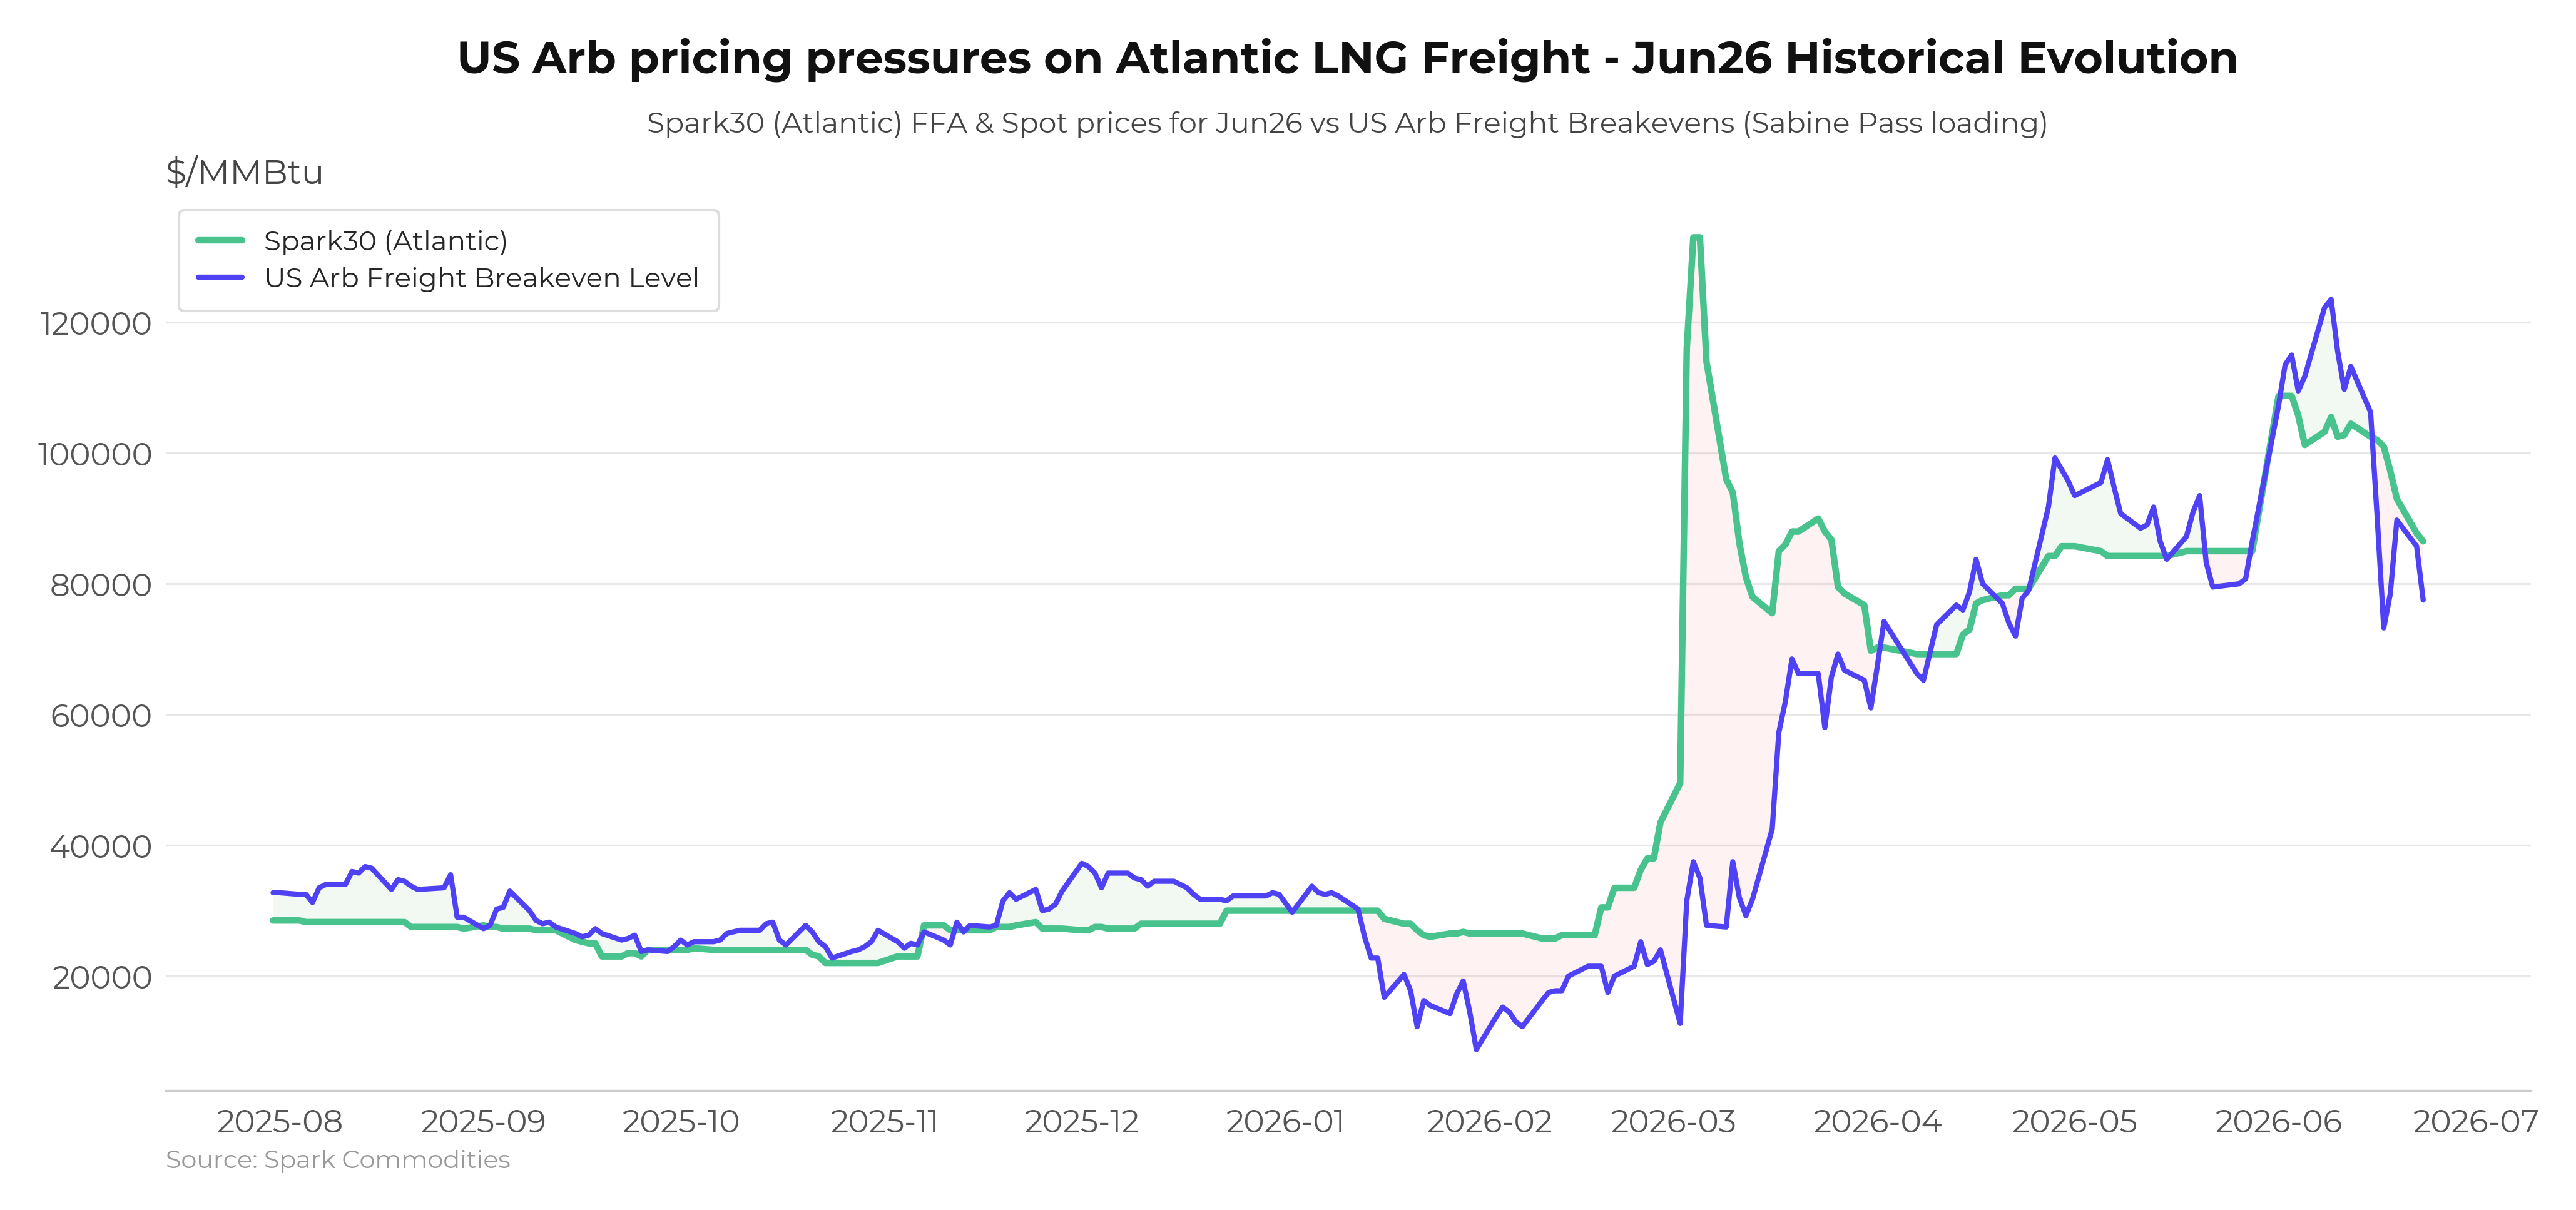
Atlantic Freight vs Arb Breakevens - Historical Month Evolution
NewTrack arb pricing pressures on Atlantic LNG freight rates for a specified month by comparing freight breakevens with Spark30 FFA and spot prices.
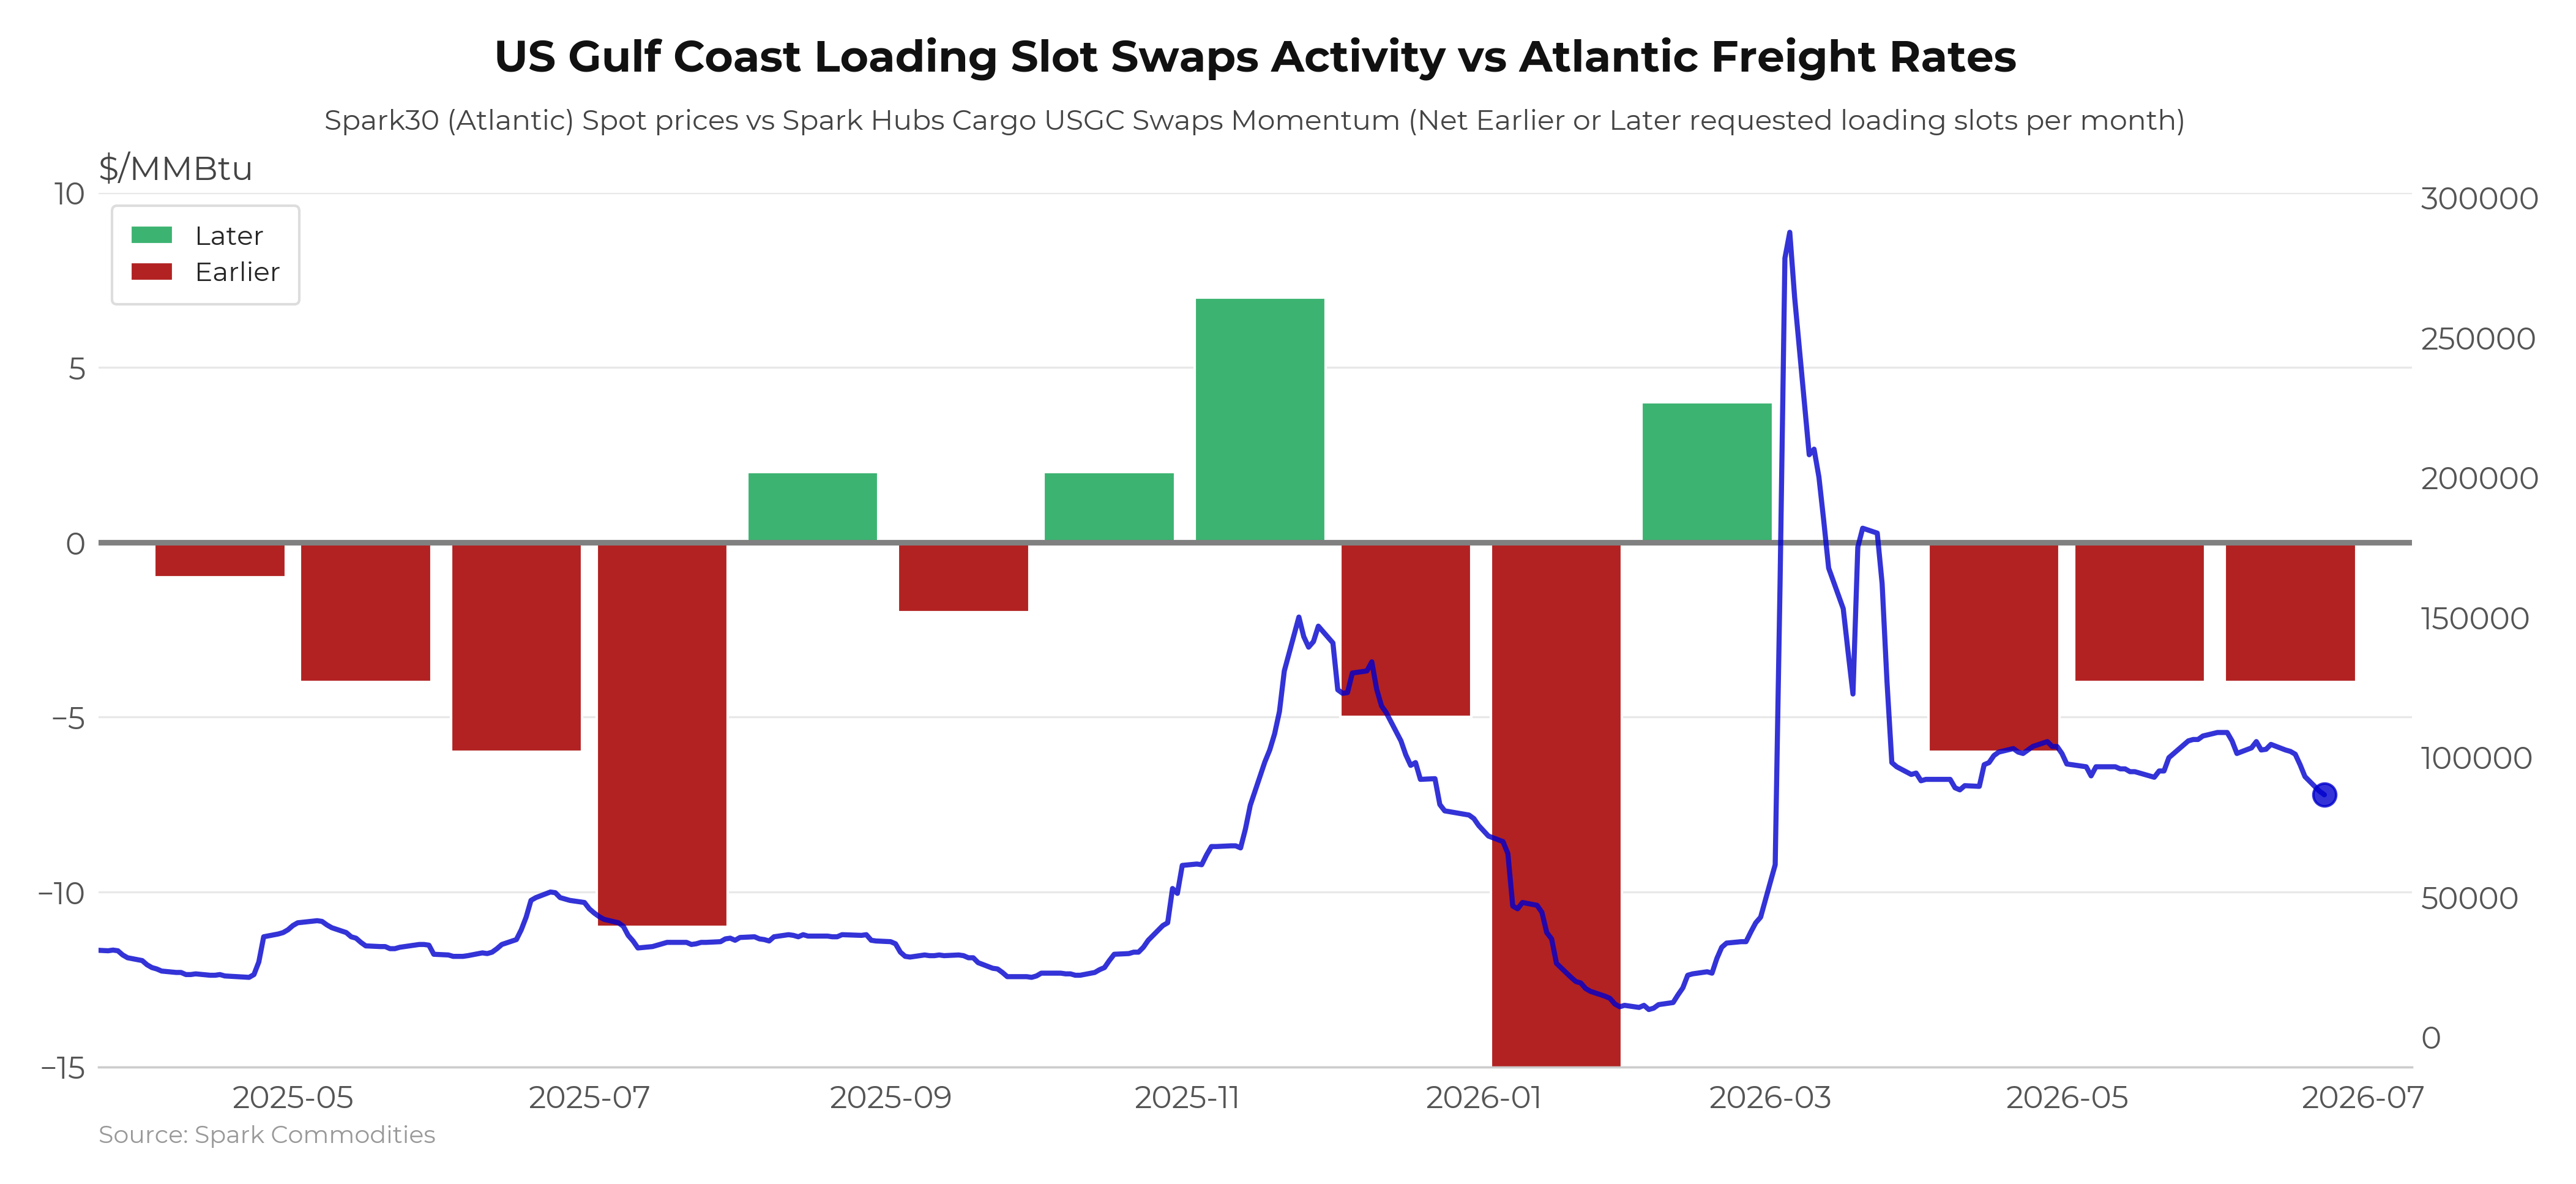
USGC Loading Swaps vs Atlantic LNG Freight rates
NewCompare Atlantic LNG spot freight rate movements with loading slot swaps activity in the US Gulf Coast.
Cargo
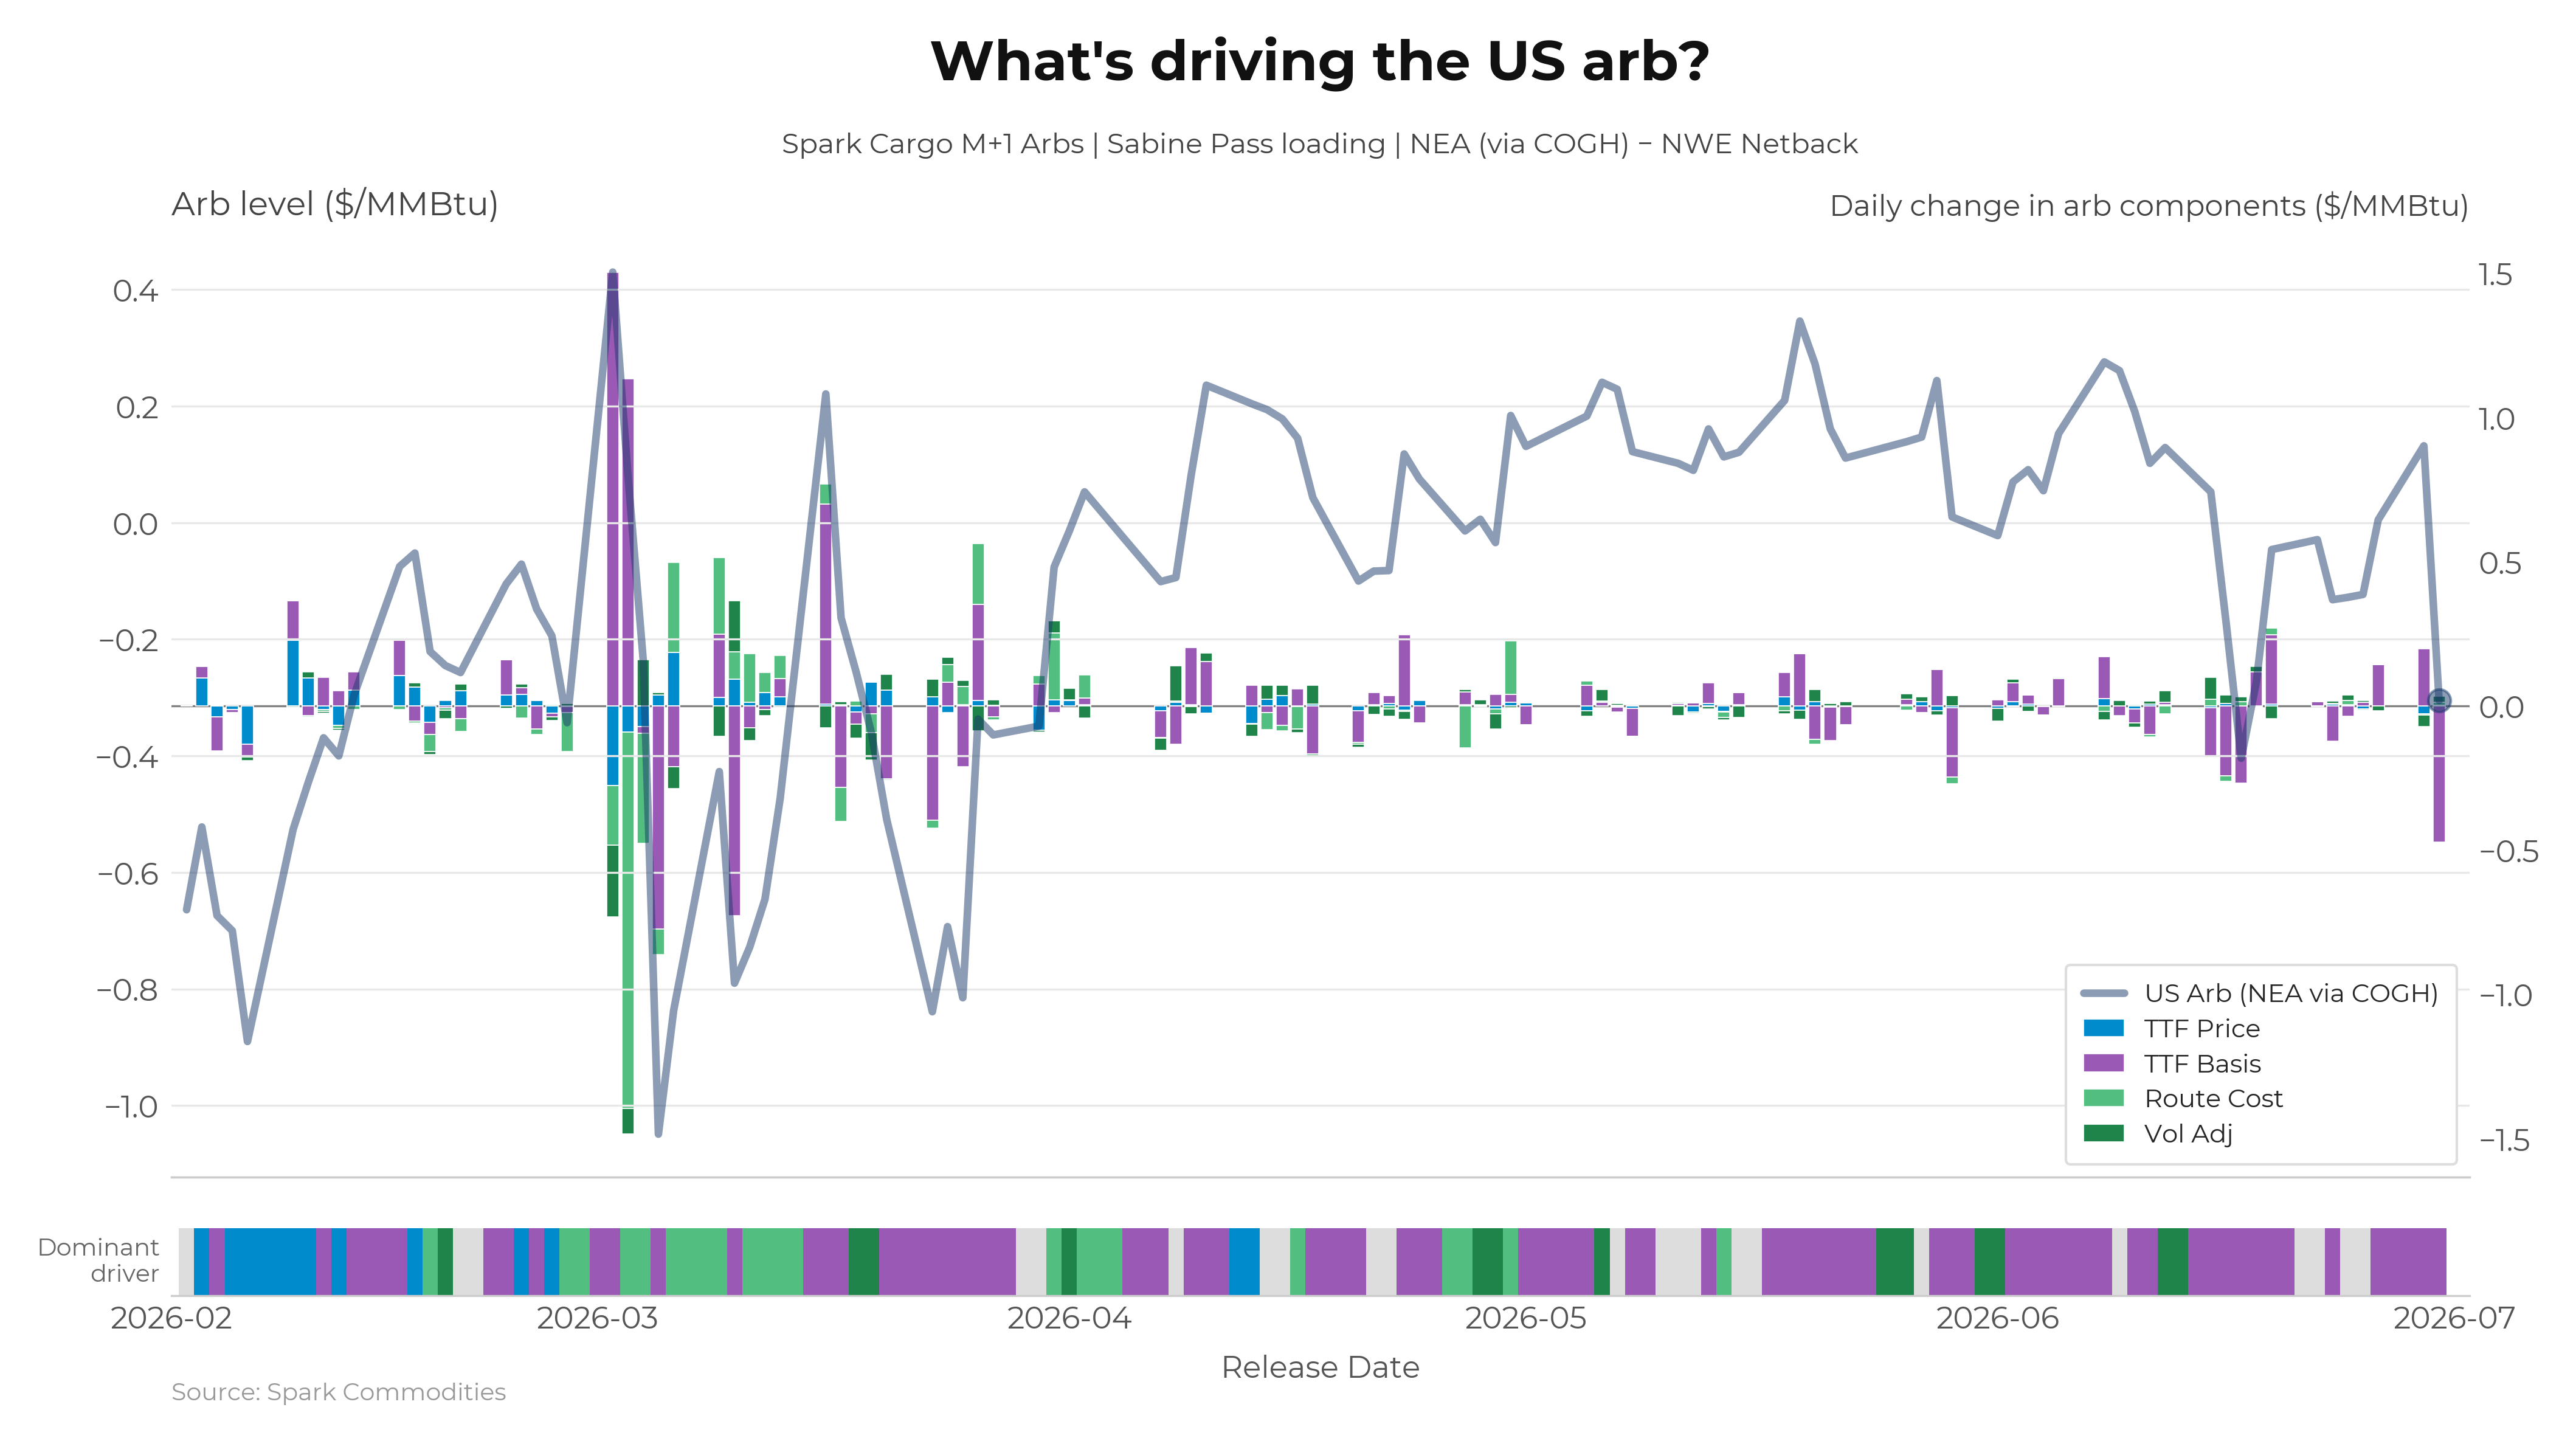
Arb Drivers Component Analysis
NewBreak down the underlying components that make up Cargo Netbacks & Arbs to understand which component is driving daily changes in the arb.
Access
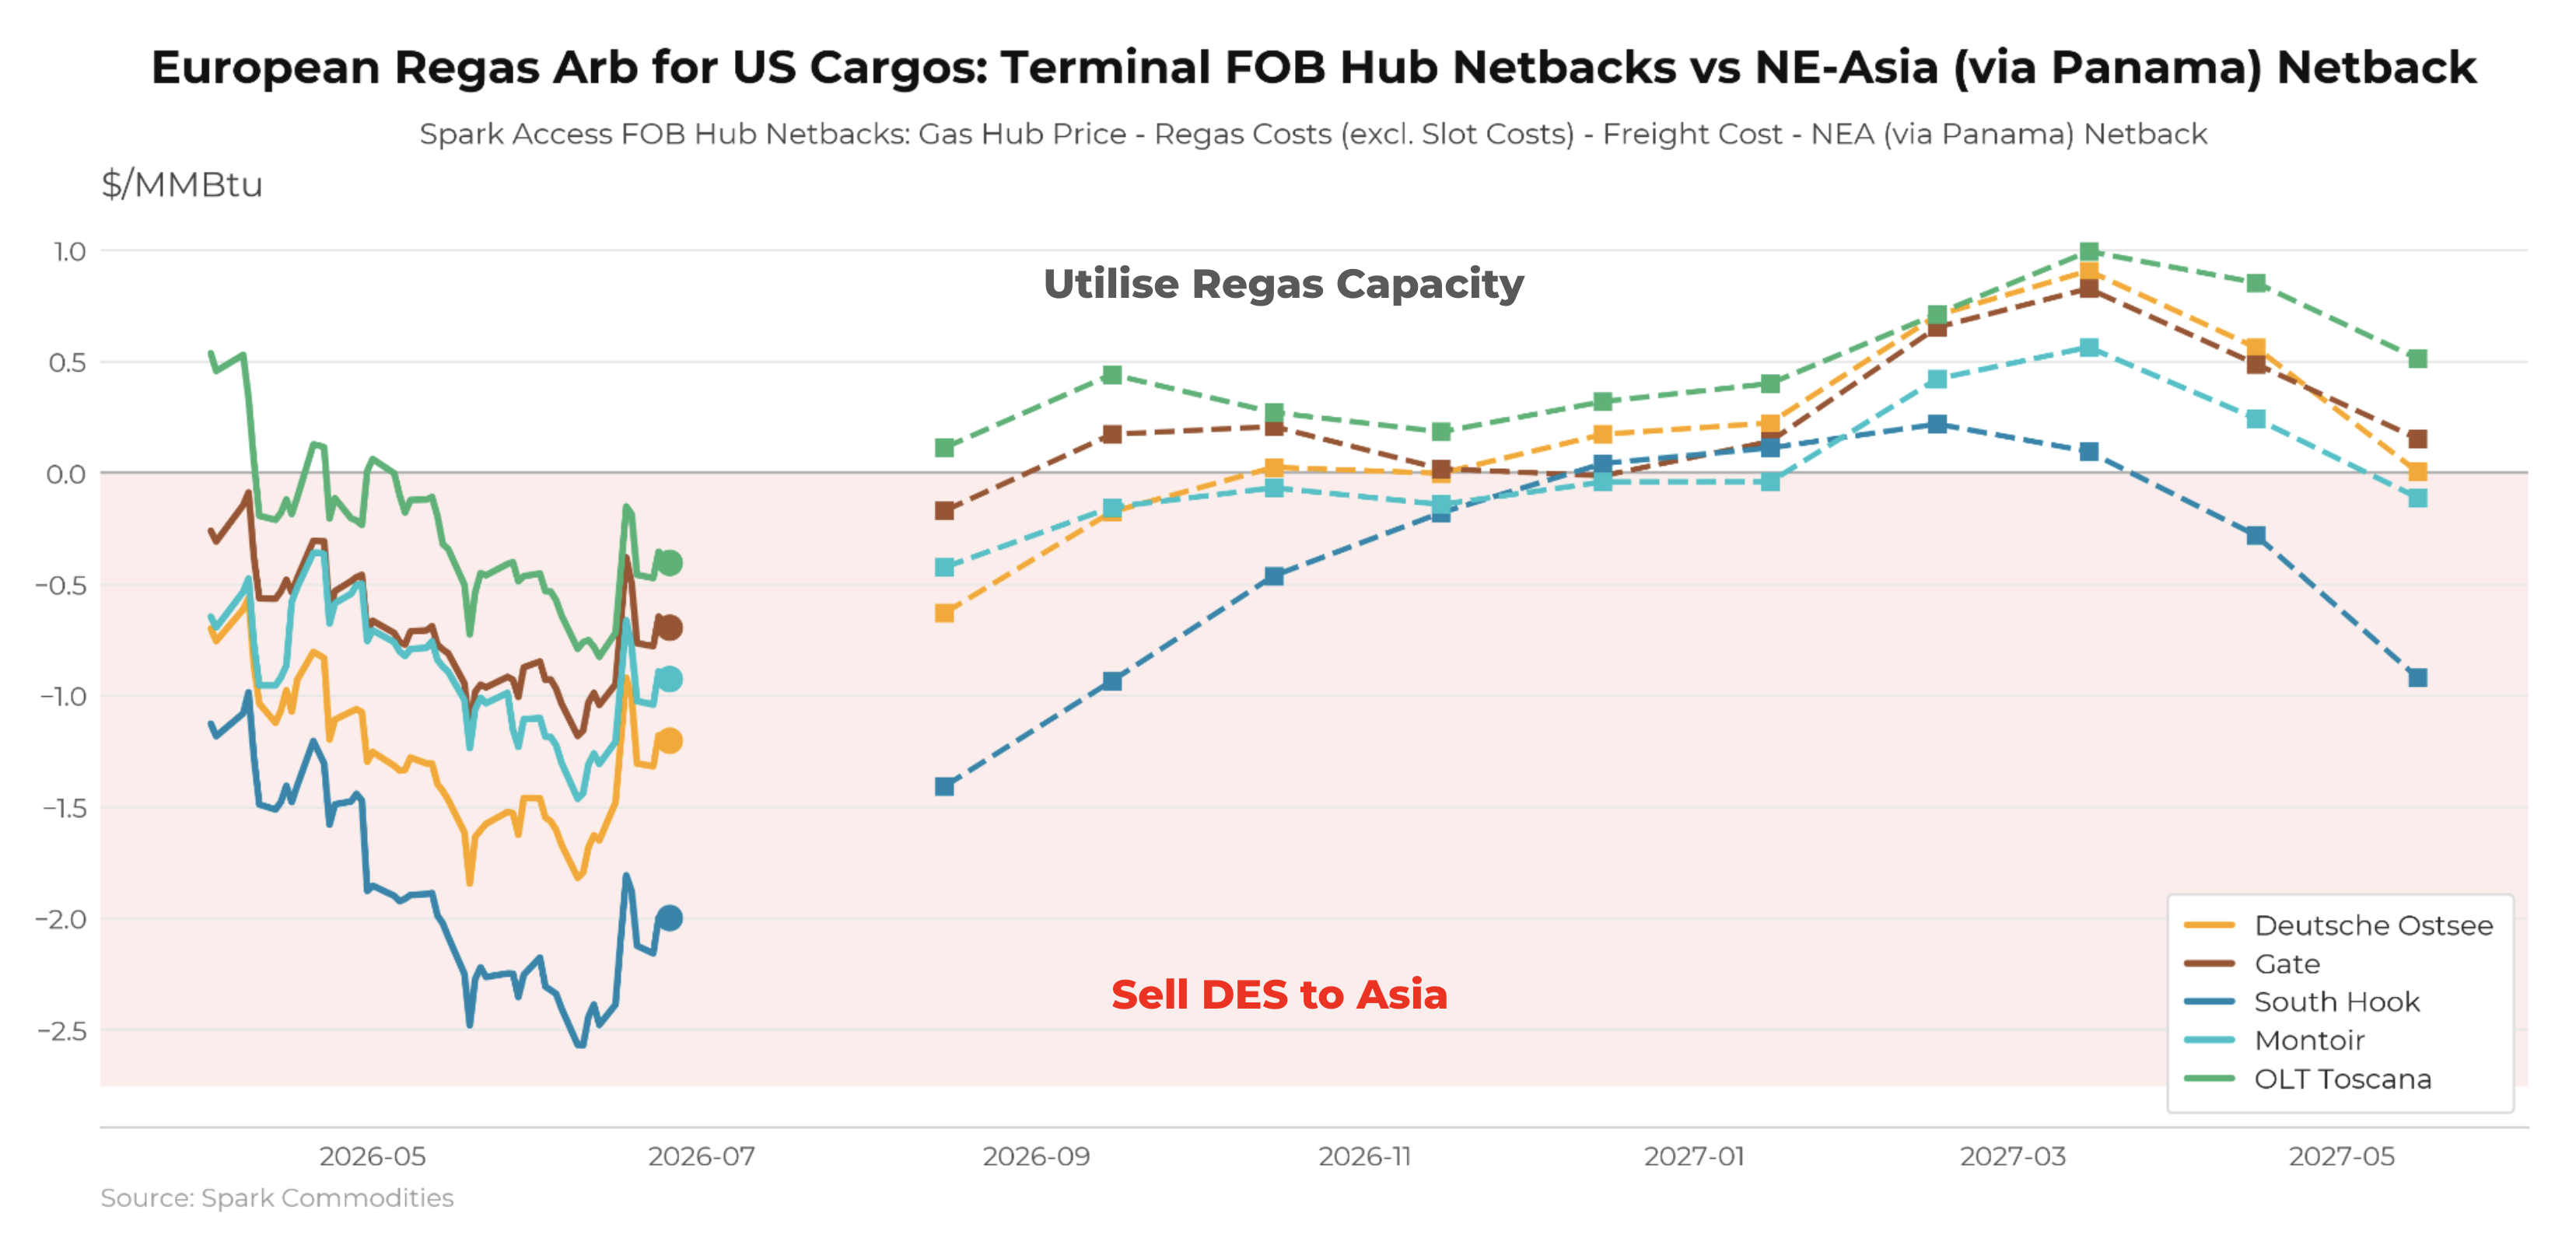
FOB Hub Netbacks vs Cargo Netbacks
NewCompare FOB Hub Netbacks against Cargo NEA/NWE Netbacks to assess the profitability of using regas capacity versus selling DES.
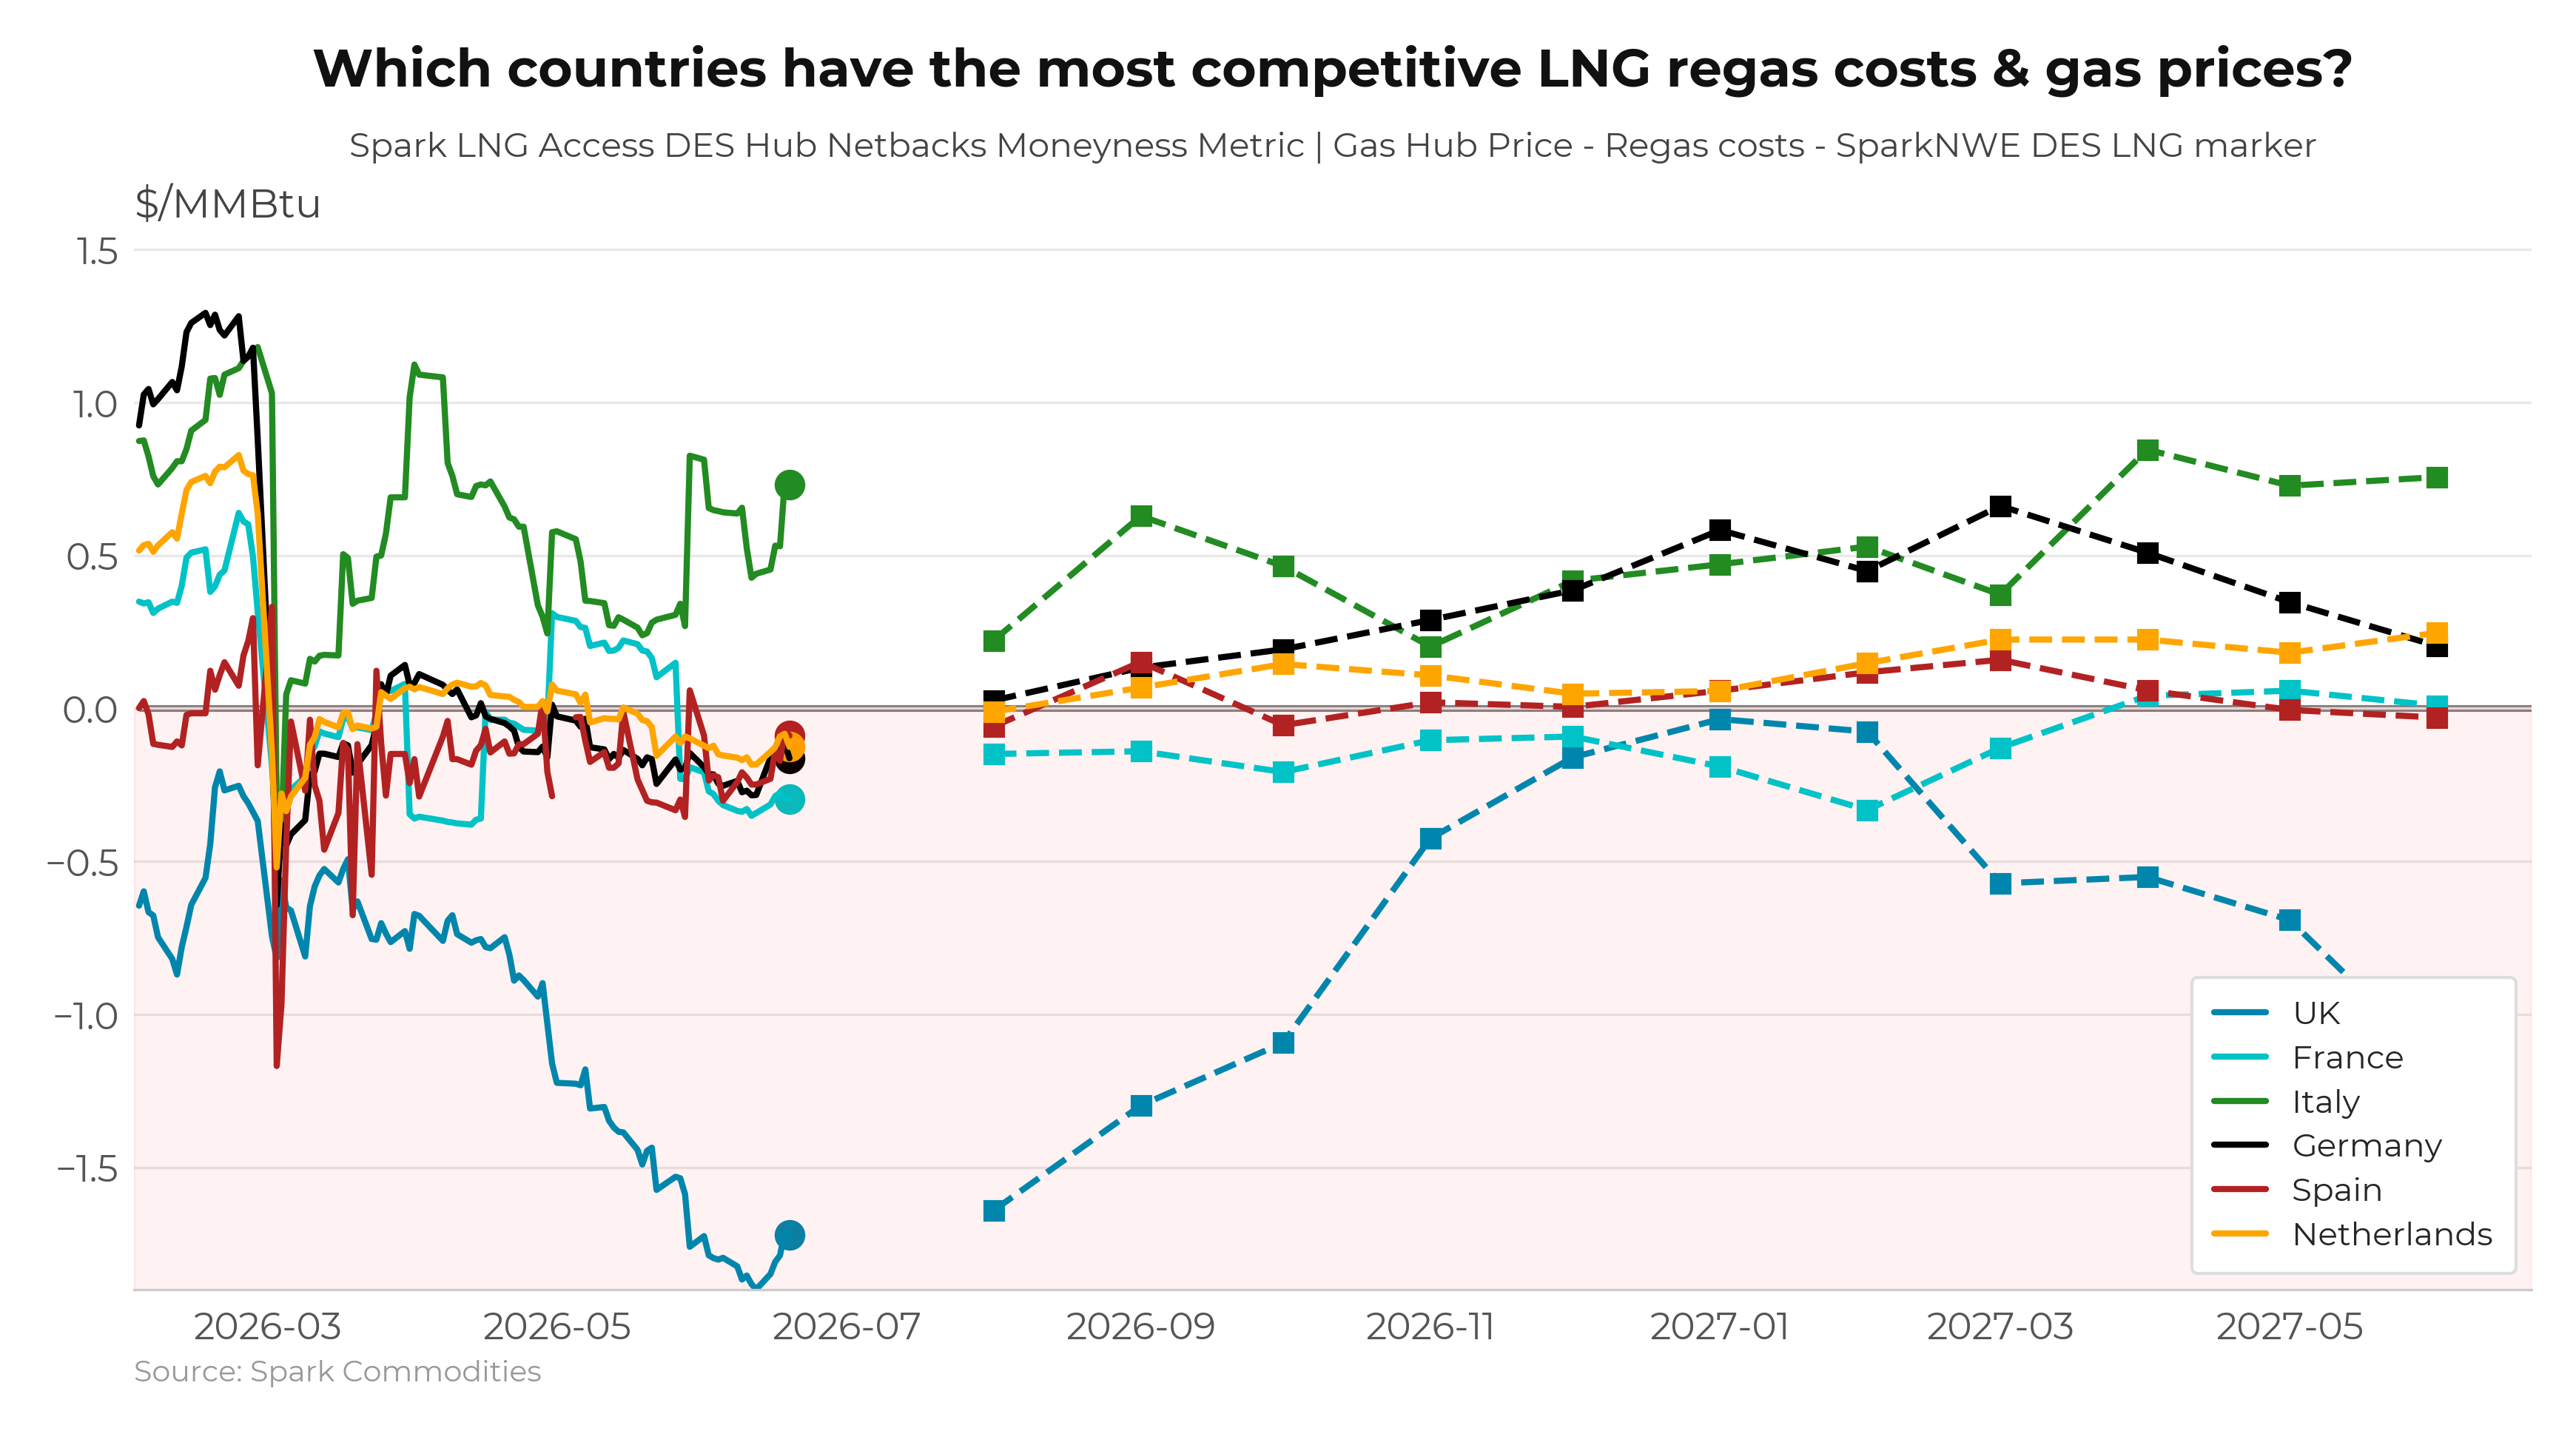
Regas Terminal Moneyness - Historical Forward Curves
NewCompare the historical moneyness of regas terminals across Europe to identify which terminals are in/out of the money, including full flexibility on per-terminal sunk costs, delivery month of choice and the ability to average by country to see which gas hubs are signalling LNG delivery.
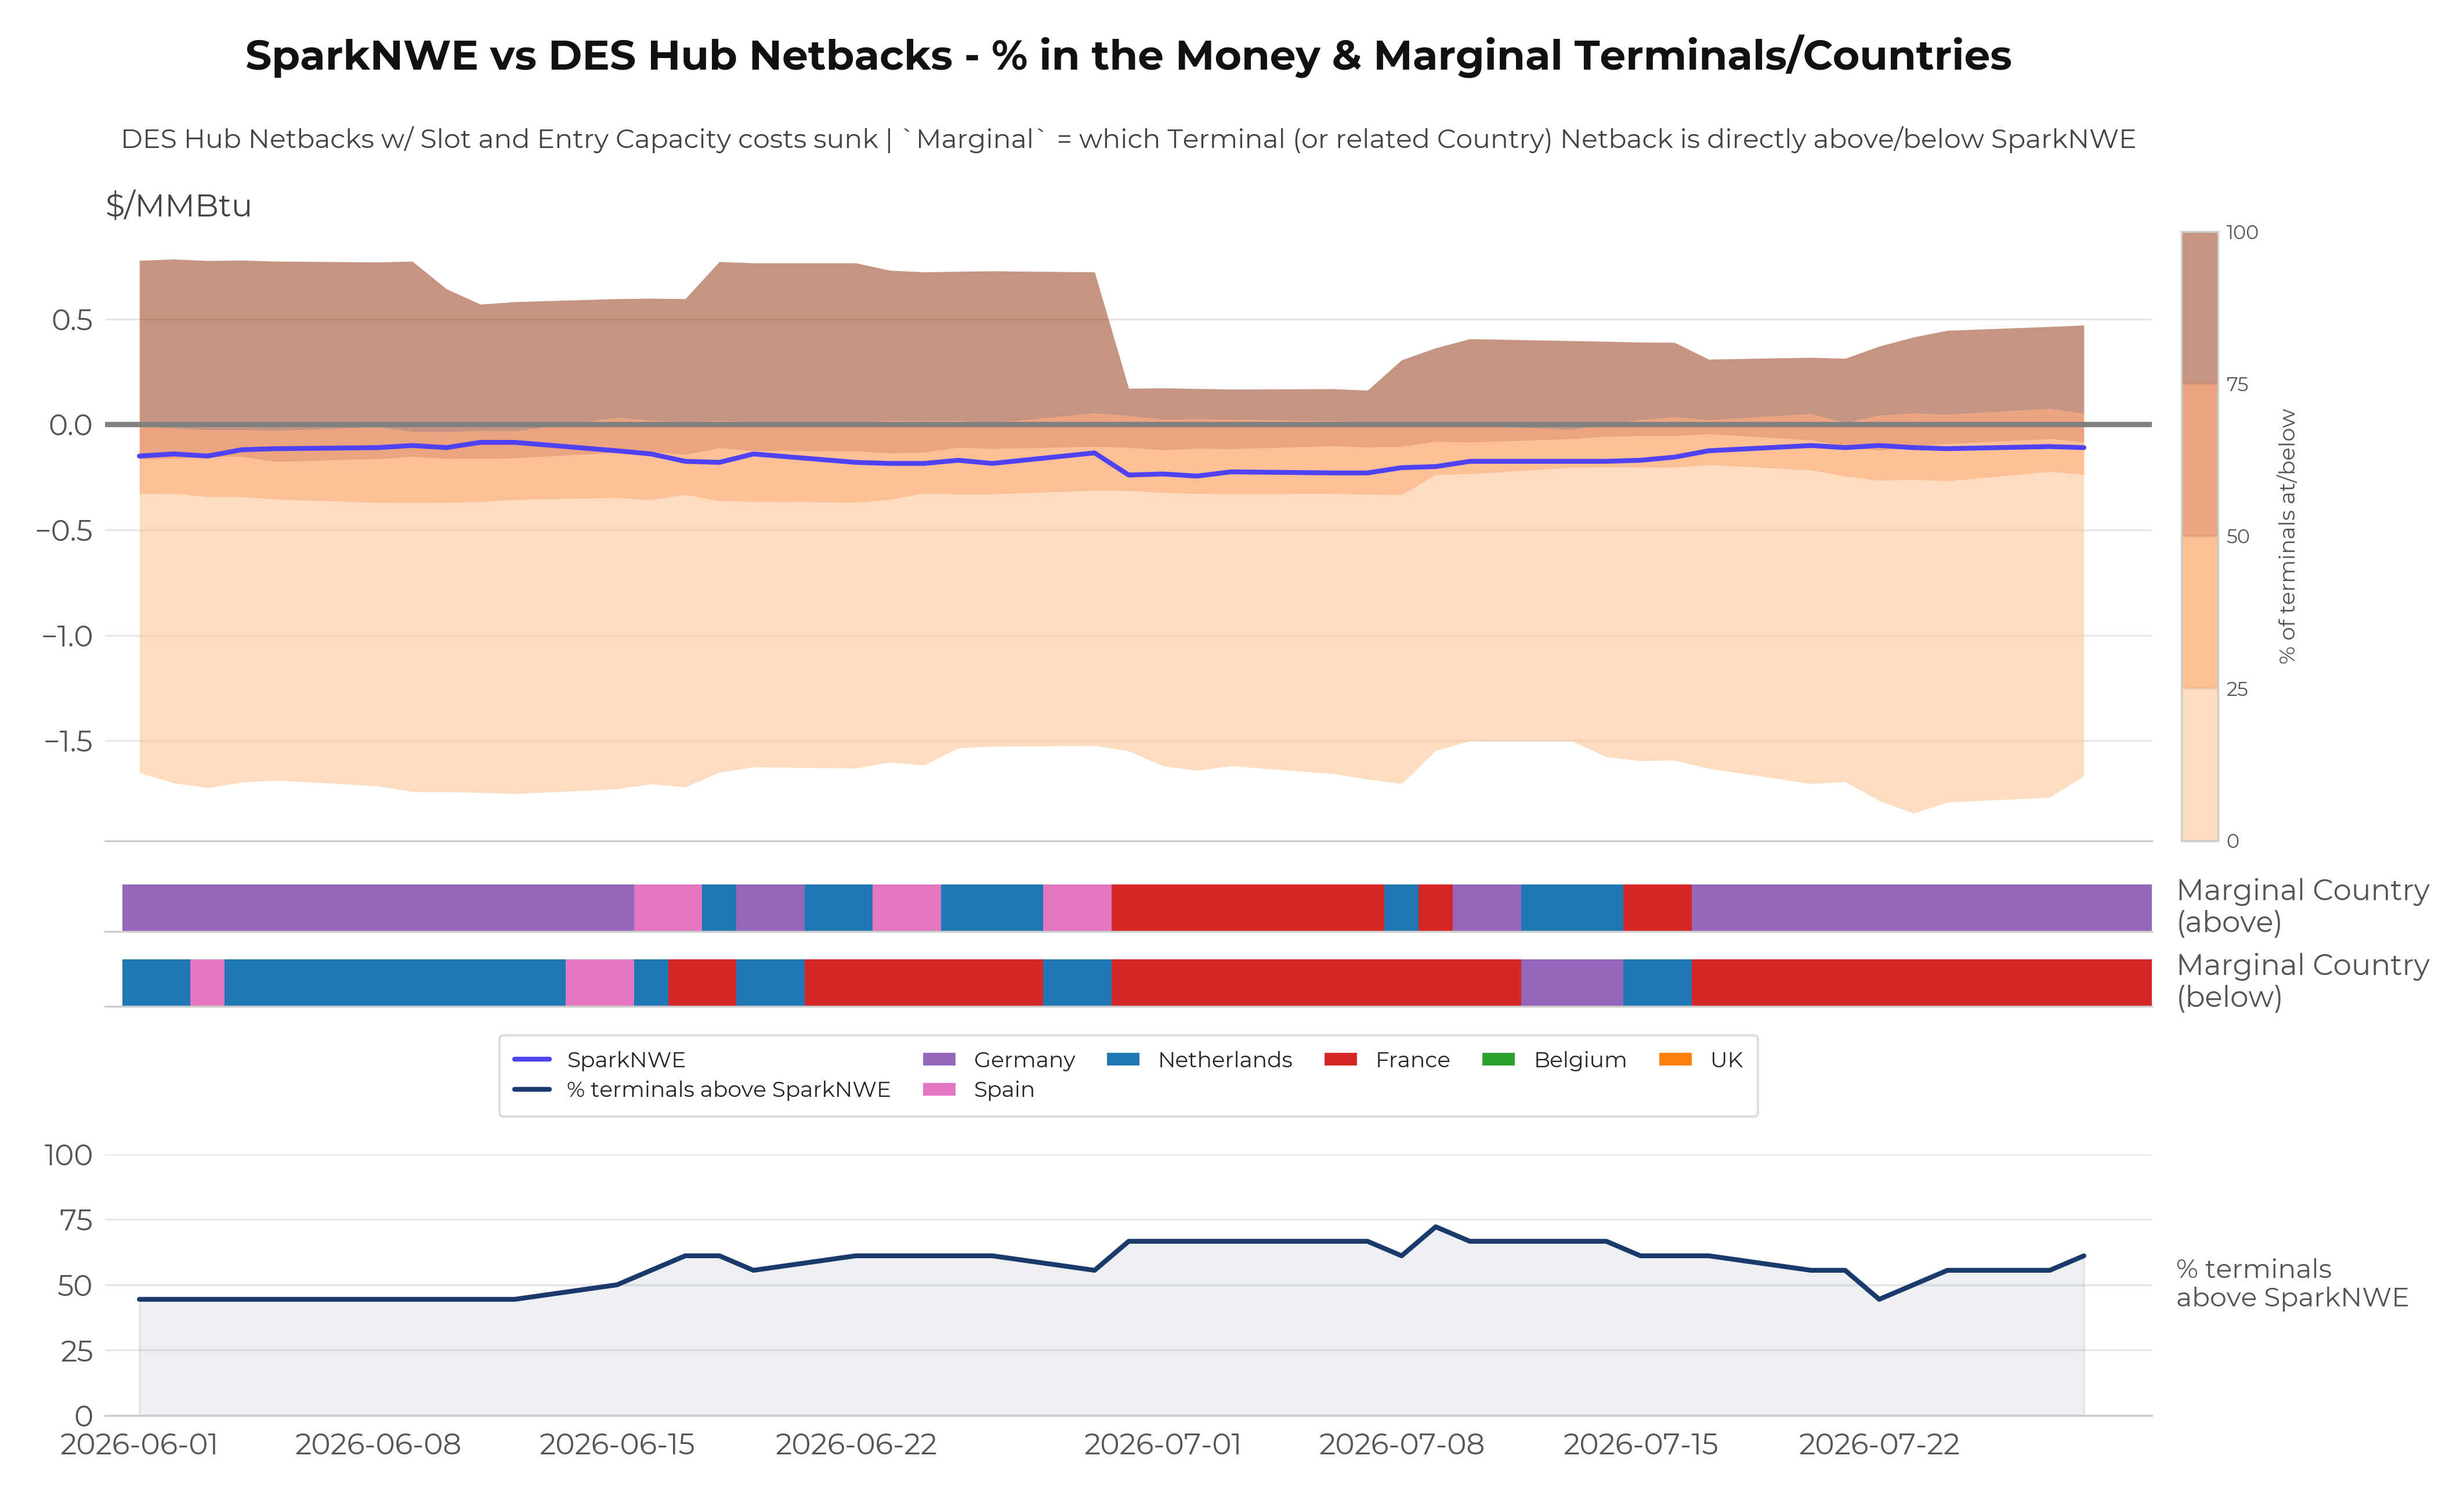
European Regas vs NWE DES LNG - Proportion of Europe ITM & Marginal Terminals
NewCompares the SparkNWE vs the front month DES Hub Netbacks to see what proportion of European regas options are considered "in the money", as well as which terminals/hubs are most marginal & could be driving factors in SparkNWE movements
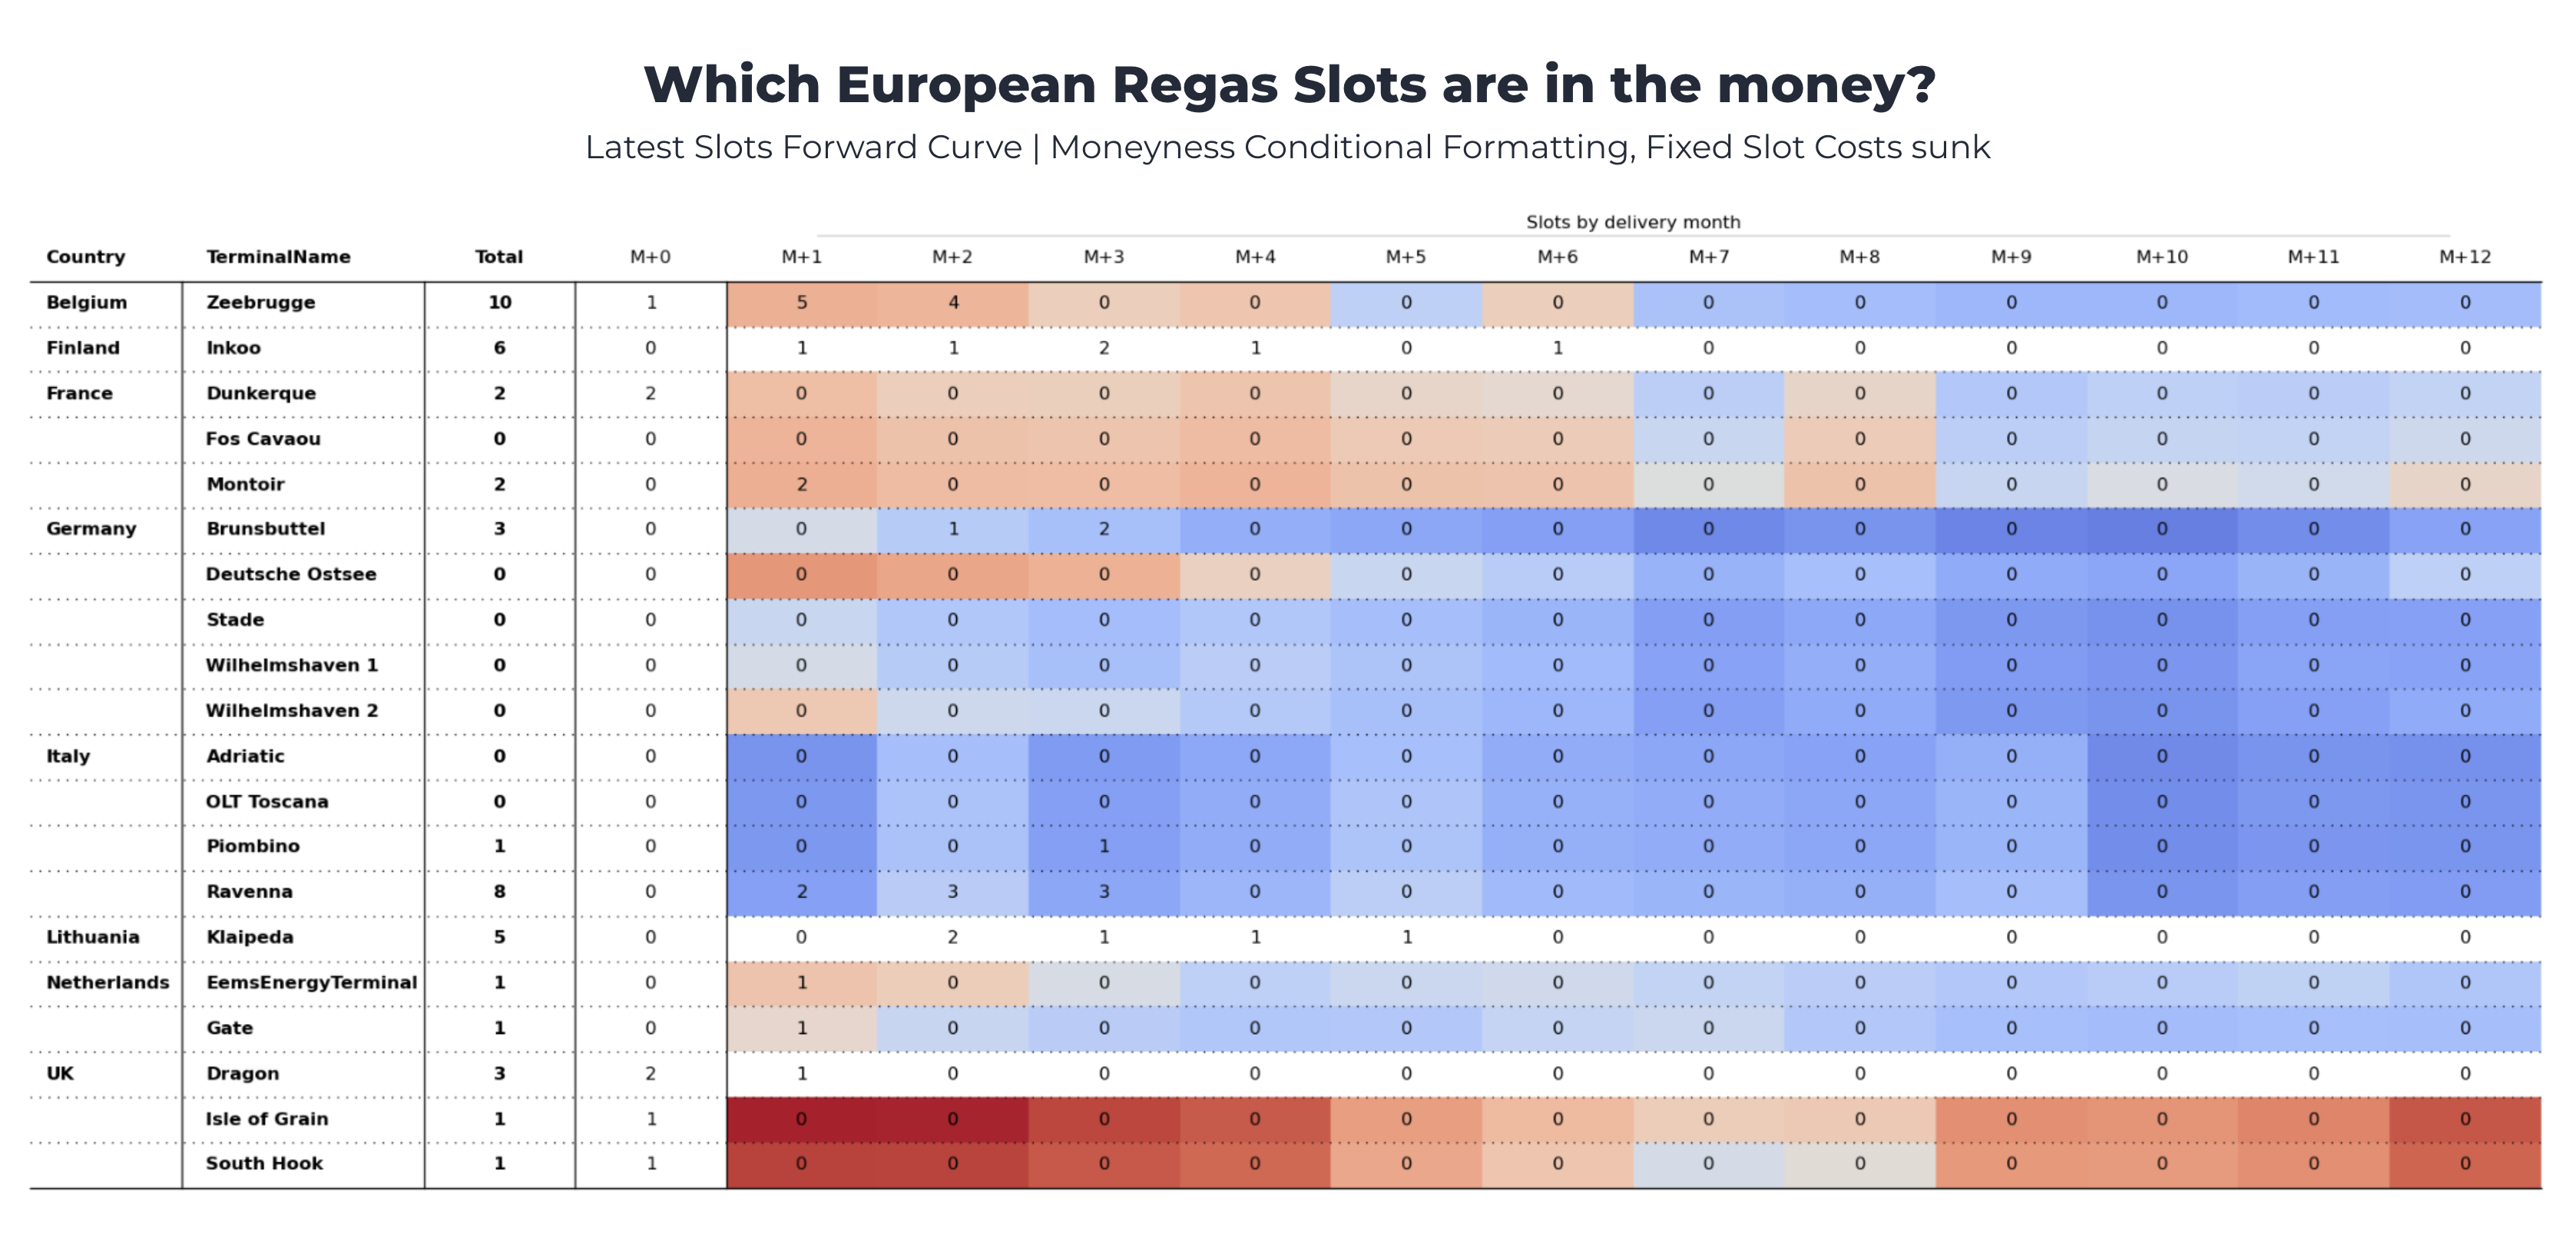
Regas Slot Moneyness Tracker
NewGenerate a formatted table showing the latest European regas slot availabilities, as well as a colourmap indicator to show how in/out the money each slot is.