LNG Freight
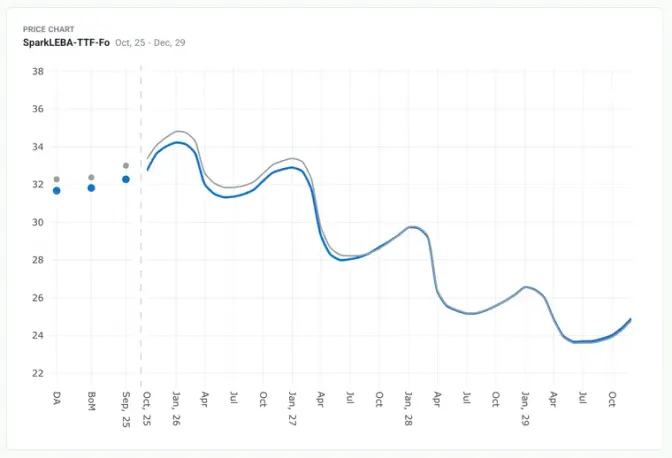
ICE listed freight price assessments (Spark25/Spark30) and forward curves that help to connect global gas markets.
Illustrative prices for demo only
Spark30S and Spark25S underpin the ICE LNG Freight Futures.
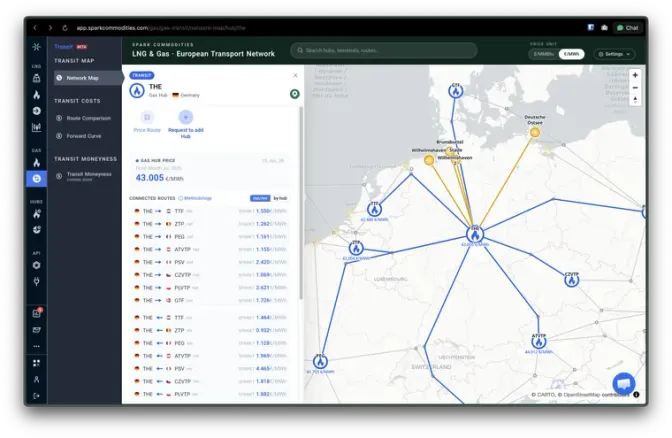
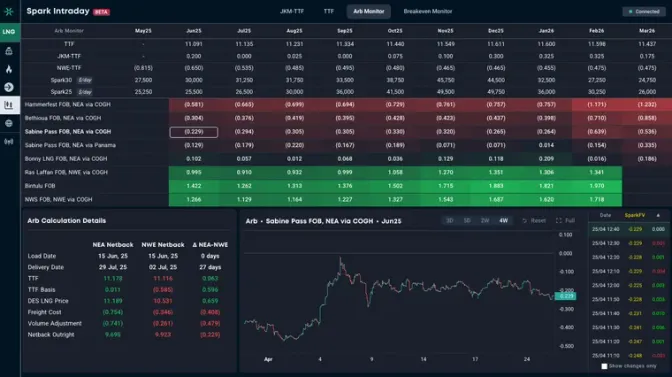
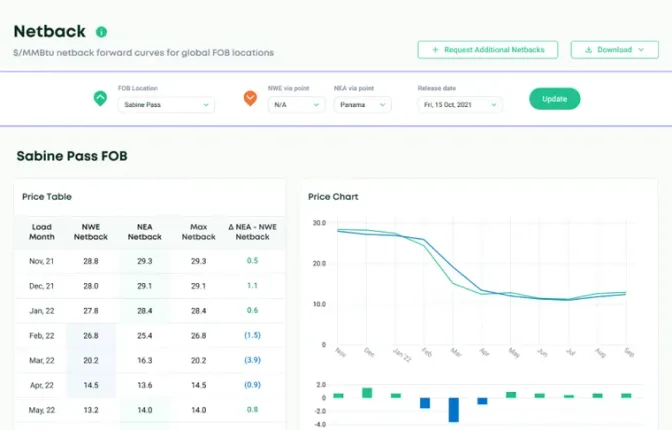
ExploreTools on the Spark platform help you analyse the data: compare route costs, run your own arb and breakeven scenarios, and track how prices evolve.
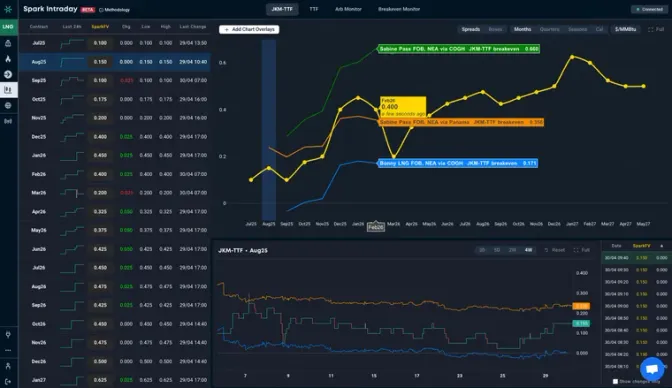
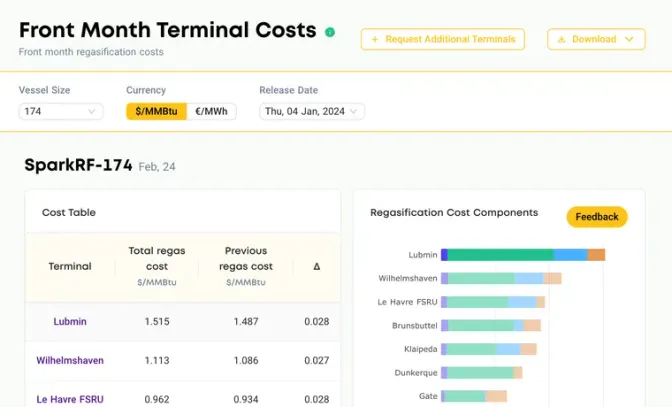
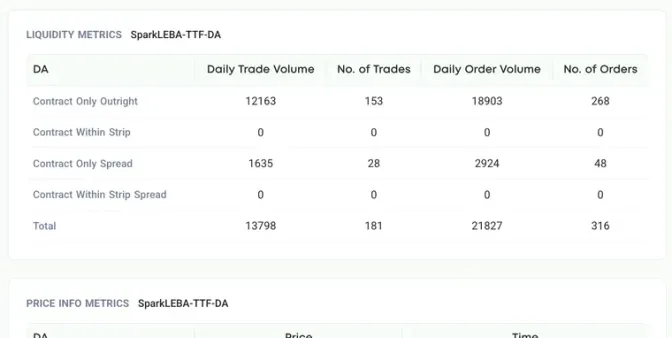
Bring Spark prices into your own systems to update forward curves, mark positions, support risk management and run your analysis, with no manual downloads.
Integrate directly with your systems, and receive new prices automatically as they are released.
Retrieve Spark prices directly from within your Excel sheet.
Call the Spark API from your notebooks to support your analysis.
Spark30S, Spark25S, SparkNWE and SparkSWE underpin ICE-listed futures.
Trusted by200+firms across the LNG value chain.